Industry Standard for Composite Log Drafting
WellCAD
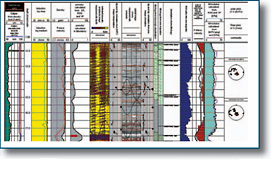
WellCAD is a PC based composite log package, which combines comprehensive graphic editing mechanisms and data processing tools.
Combining technically excellent display, editing and analysis capabilities for well data, WellCAD has become the standard log composite software in the Mining, Oil & Gas and Geotechnical society and is used in a wide range of applications.
The basic module incorporates all features and tools necessary to import, edit, process and display your Well data. The software is delivered with a set of Templates, Headers, Dictionaries customized for specific application. You can of course easily modify existing ones or create you own.
Data import/export
ASCII, CSV, TXT files, ASCII,
Bitmap files (*.bmp, *.tif)
Many 3rd party proprietary files
LIS/DLIS (optional)
Data presentation
WellCAD handles a wide range of data types from wire line data, Core data, images, comments and many more. All data are numerical and can be edited in a separate spread sheet view (tabular editor) .
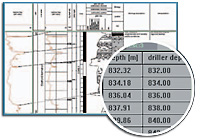
Depth management
Multiple depth management (time, depth, TVD)
Advanced depth matching tool
Slice, shift, merge, resample, filter curves with results display alongside the original data.
Computations
Formula parser (curve calculator with multiple discriminators) User programming/batch processing
Add your own process routine and specialised task using Visual Basic and/or OLE automation.
Output
Copy/paste to any windows application
Export document as BMP/EMF
Output to any Windows-supported printer
Distribute the document with free WellCAD Reader
CoreCAD /wellsite
.
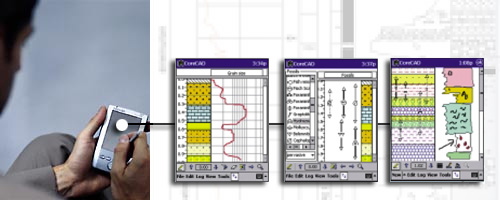
CoreCAD is available as add-on to WellCAD software for PC and also as a standalone application for pocket PC
• All parameters described graphically are stored as real digital data – ready to export
• Multiple depth system management
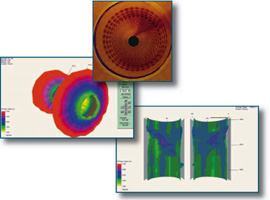
• Import Core photographs
• Import hand drafted Core descriptions, digitize the data or integrate them into composite log chart
• Fully customizable system for easy and quick creation of all Core description data types from biostratigraphy, to diagenetic minerals & depositional subenvironment.
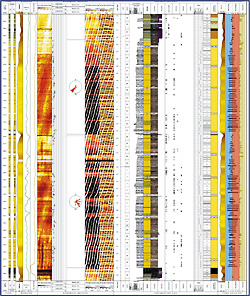
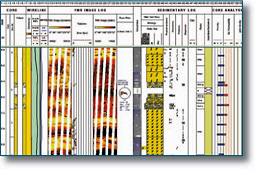
Borehole image analysis
Borehole image data from a variety of tools including acoustic televiewer, optical televiewer, Corescanned images, FMI, FMS, CAST, CBIL, UBI and STAR and Sondex MIT are supported.
For data available in LIS/DLIS format files, you will have to use the LIS/DLIS add-on module.
Data processing
Before any form of analysis is performed, the data needs to be processed.
This involves the creation of a reliable high quality image from raw tool measurements. It consists of a number of procedures.
• Log quality control: check both image and orientation measurements)
• Reconstruction of the data for variation in tool properties or at acquisition time
• Corrections of the actual measurements
A number of processing options are available for enhancing the quality of the data.
These includes:
• Bad trace interpolation
• Amplitude normalization
• Despiking filters
• Correction of decentralisation
• Image orientation
Data presentation
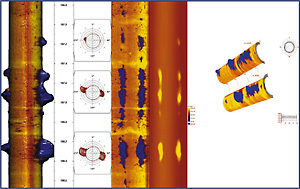
Data can be visualised as 3D images using 3D borehole view (ideal to visualise breakouts, well deformation, pipe corrosion)
Data interpretation
Any number of sinus curves can be interactively picked recording azimuth and dip values.
Each pick can be qualified into user definable categories using (ToadCAD) module
Picks can be displayed as sinus, tadpole or stick plot.
Fully interactive structure interpretation including polar and rose diagram.